

October 2026 Maui Market Report: Key Shifts in Single-Family & Condo Data


Aloha, Maui! As we close out October 2026 and look toward the final months of the year, our local real estate landscape continues to tell a nuanced story. If you noticed any missing details or wondered why certain overview sections appear streamlined, it is because the core REALTORS® Association of Maui data report separates its macro-level overview into specialized geographic and property-type sections. To give you the complete picture, this comprehensive breakdown dives deep into every single Key Performance Indicator (KPI) across Single-Family Homes, Condominiums, and Land sectors, offering deeper context and analysis on what these shifts mean for buyers, sellers, and investors across the Valley Isle.

1. Single-Family Homes: Navigating Inventory and Price Adjustments


The single-family sector this October experienced a noticeable contraction in new pipeline activity, paired with downward pressure on median prices, creating a unique window of opportunity for buyers who have been waiting for breathing room in the market.


  • New Listings

    • October 2026 saw 81 new single-family listings enter the market, representing a sharp 22.9% decrease compared to October 2025's 105 listings. On a year-to-date (YTD) basis, listings moved from 994 down to 967, reflecting a mild 2.7% drop. This indicates that homeowners are exercising some caution before listing.

  • Pending & Closed Sales

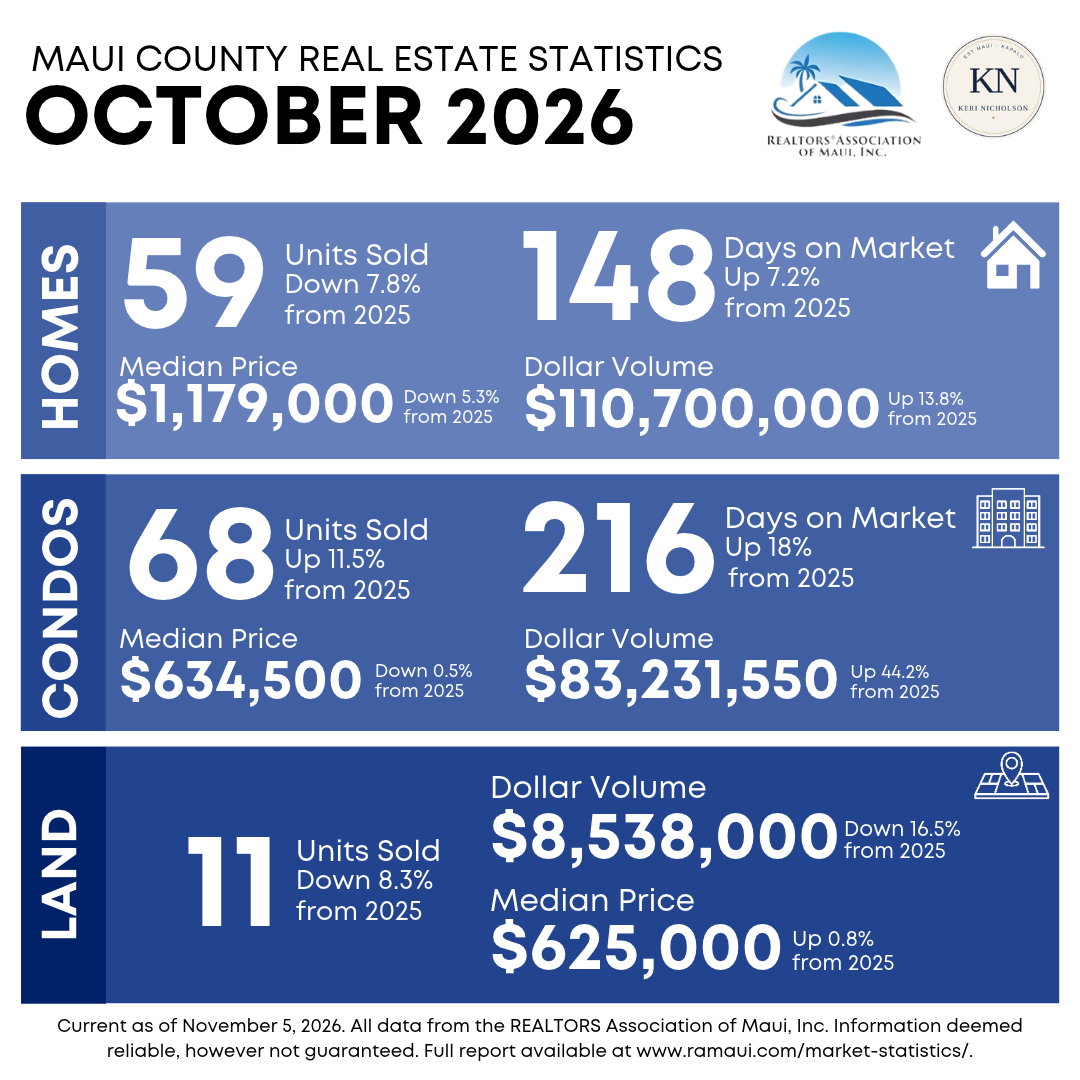
    • Pending sales (properties under contract) decreased by 7.0% year-over-year in October down to 53, though YTD pendings actually rose 6.5% to 590. Closed sales similarly dipped 7.8% for the month (from 64 down to 59), while YTD closings remained steady at 596 (up 0.8%).

  • Days on Market Until Sale

    • Buyers are taking slightly longer to make decisions or navigate negotiations. The average days on market increased by 7.2% year-over-year to 148 days, up from 138 days in October 2025. The YTD average sits closely at 140 days.

  • Median & Average Sales Prices

    • The single-family median sales price decreased by 5.3% in October to $1,179,000 (down from $1,245,000 a year prior). However, the average sales price jumped significantly by 23.0% to $1,876,271, heavily influenced by high-value luxury transactions closing during the month.

  • Percent of List Price Received

    • Sellers achieved an average of 94.9% of their list price in October, marking a minor 1.1% dip from October 2025's 96.0%, signaling that buyers retain negotiating leverage.

  • Housing Affordability Index

    • The affordability index for single-family homes ticked down 5.7% to 33 (compared to 35 last year), meaning local households continue to face affordability hurdles under prevailing interest rates.

  • Inventory & Months Supply

    • Active inventory held completely flat year-over-year at 445 homes for sale. Because of shifting sales paces, the months supply of inventory decreased by 7.3% to a 7.6-month supply, providing a slightly more balanced environment than the tighter conditions seen earlier in the cycle.

2. Condominium Market: Strong Closed Sales and Absorbing Inventory


The condo sector exhibited dynamic trends this October, highlighted by a notable surge in actual closed transactions alongside a steady reduction in overall market overhang.


  • New Listings

    • Unlike single-family homes, condo new listings held steady with a 0.7% increase, recording 145 new properties brought to market compared to 144 in October 2025. YTD new listings decreased by 7.9% to 1,367 units.

  • Pending & Closed Sales

    • Pending sales experienced a 25.7% decrease for the month (down to 52), yet YTD pendings remain strong, up 17.1% at 686. More importantly, closed sales jumped 11.5% in October to 68 transactions, while YTD closed sales surged 20.1% to 688 closed deals.

  • Days on Market Until Sale

    • Condos spent more time on the market, with average days increasing by 18.0% year-over-year to 216 days, up from 183 days in October 2025.

  • Median & Average Sales Prices

    • The condo median sales price remained virtually unchanged, dipping a negligible 0.5% to $634,500. Meanwhile, the average sales price climbed 29.3% to $1,223,993, reflecting higher-tier trades, particularly in luxury resort corridors like Wailea and Kā‘anapali.

  • Percent of List Price Received

    • Sellers received 94.8% of their list price on average, holding remarkably steady (+0.1%) compared to the previous year.

  • Housing Affordability Index

    • The condo affordability index moved to 62 (a 7.5% decrease from 67 last year), continuing to offer a lower entry threshold relative to single-family housing.

  • Inventory & Months Supply

    • Active inventory saw a healthy correction, dropping 4.0% down to 818 units. Driven by strong absorption, the months supply of inventory decreased significantly by 15.8% to a 12.3-month supply, indicating that excess inventory is steadily working its way through the market.

3. Land Market: October Activity and YTD Overview


Land transactions across Maui add another layer of insight into where future construction and custom development are heading.


  • October Sales Volume & Activity

    • In October 2026, the land sector recorded 11 closed sales across the island, representing a total dollar volume of $8,538,000.

    • The overall median sales price for land transactions finalized in October was $625,000.

    • Regional activity showed targeted pockets of buyer interest: Kula/Ulupalakua/Kanaio led with 3 sales totaling $2,785,000 (median price $675,000), Haiku recorded 2 sales totaling $2,229,000 (median price $1,114,500), and Wailuku logged 2 sales totaling $1,070,000 (median price $535,000). Single sales were also registered in Lahaina ($680,000), Maui Meadows ($750,000), Olowalu ($625,000), and Molokai ($399,000).

  • Year-to-Date (YTD) Land Performance

    • Looking at the broader YTD picture through October, the Maui land market logged 102 total sales compared to 119 during the same period in 2025 (-14.3% change).

    • Total YTD land dollar volume reached $86,554,550, reflecting a shifting appetite for vacant land parcels as buyers weigh custom building costs and permitting timelines. The YTD median sales price for land stands at $625,000.

Summary Takeaway

October 2026 data illustrates a maturing Maui real estate environment. While single-family inventory stabilizes and pricing experiences healthy micro-adjustments, the condominium market is actively absorbing supply with solid closed sales figures. Whether you are looking at residential homes, resort condos, or custom land opportunities, having granular data is essential for making informed decisions. To review the complete statistical breakdown, you can access the original RAM market statistics file.

If you would like a customized breakdown for your specific neighborhood or property type, feel free to reach out!

Keri Nicholson
West Maui Real Estate Specialist

📞 Phone: (808) 250-1163

✉️ Email: [email protected]

🌐 Website:WestMauiHomeSales.com

Licensing: REALTOR® Broker, RB-24151 | Coldwell Banker Island Properties